Background
Caroline Fontana and Laurence Cuny have undertaken a research and sound creation project around social dances and venues for dancing in the Drôme area.
This project is based on interviews with dancers or former dancers and recordings of collective dance practices and balls. It focuses on the specificities of dance on this region since World War II: the different dances, their origins, their transmissions, their places, their movements. It is also focused on dance as a distinctive experience of the relationship with another, both physical and sensual.
The restitution of this work materializes through sound fragments (testimonies, atmospheres) recorded on different locations across this area.
The commission was to conceive an autonomous digital object accessible on the internet which could render this research work, in collaboration with the illustrator Magali Charrier.
Role
For this project, I did the user experience design, the interface design and the development from prototypes to the functional tool. The illustrations and the visual identity were created by Magali Charrier.
Issues
- Transcribe the warm and lively aspect of the information collected.
- Preserve the advantage of sound information, namely its ability to be “experienced from the inside, without the visual a-priori.”
- Stimulate immersion
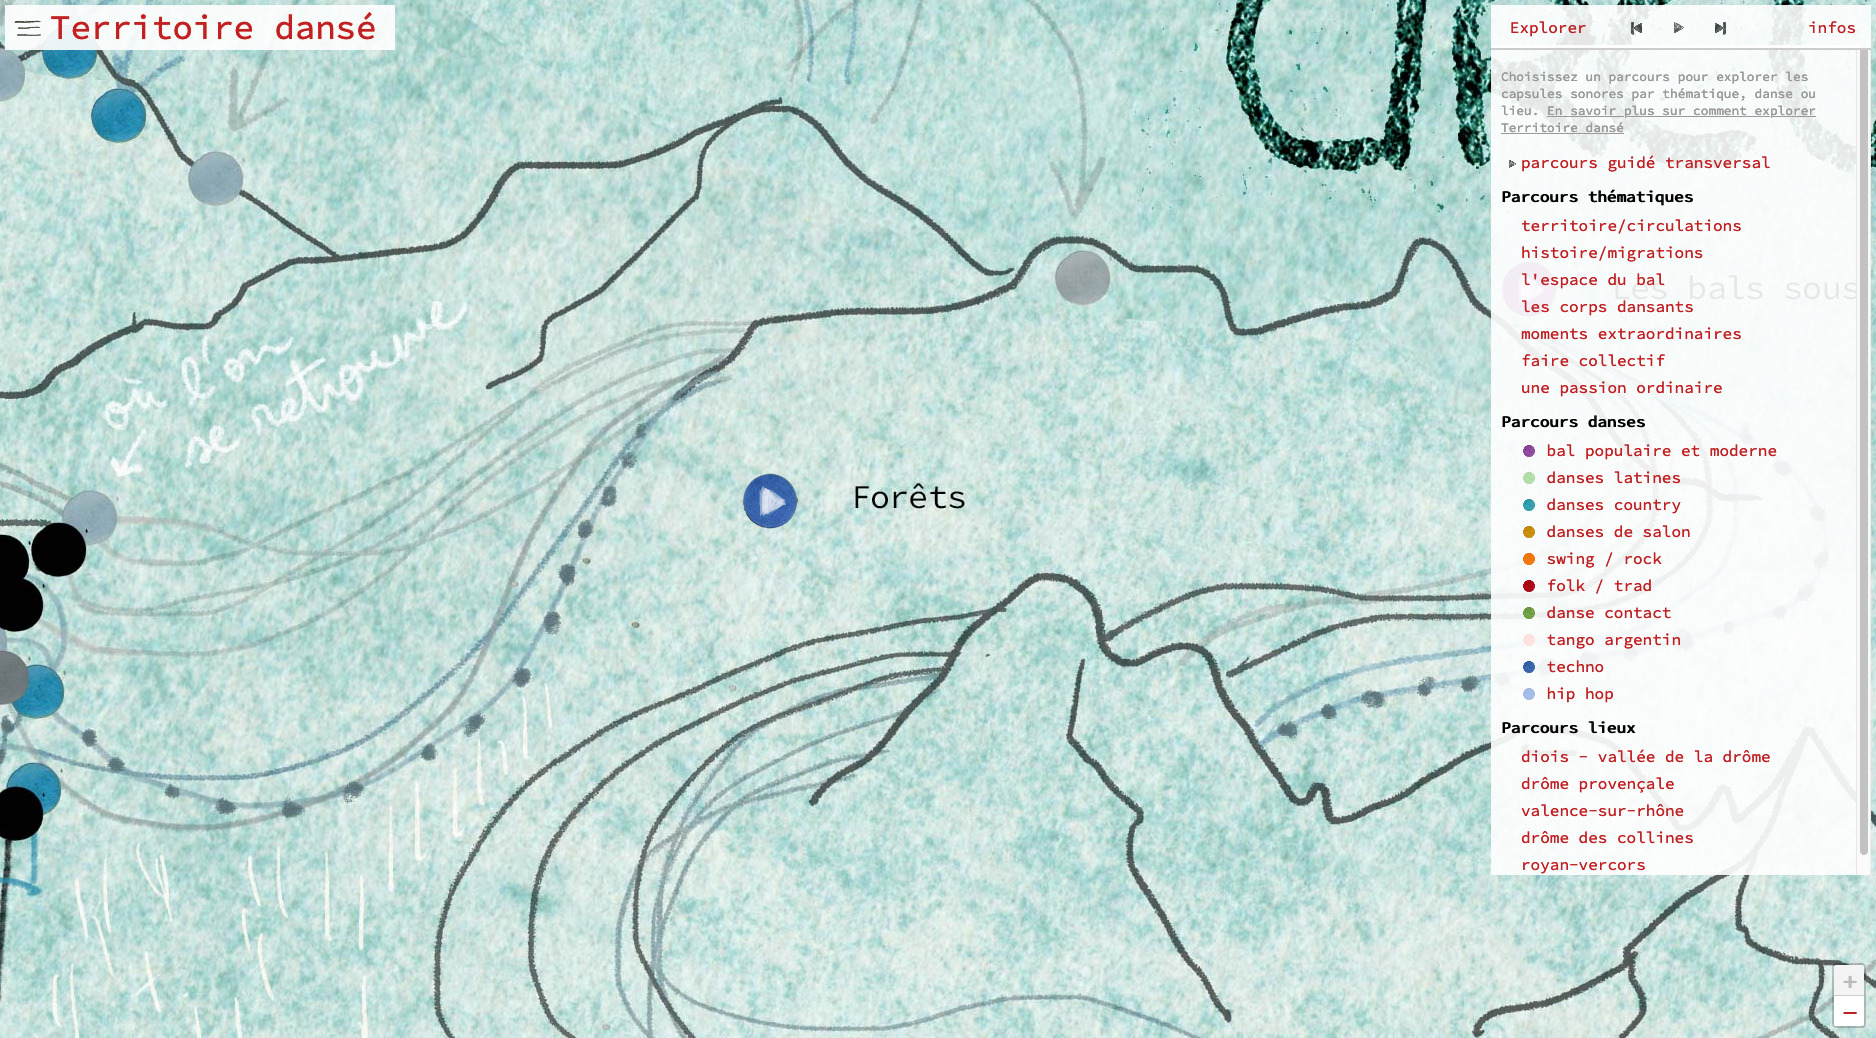
- Allow multiple navigation: editorialized, but also geographical or by dance, according to the visitor’s preferences or a random path.
Methodology
We chose to implement an iterative method, given the experimental, artistic and ” work in progress ” dimension of the project. The design process was punctuated by physical and virtual meetings, allowing us to validate the ideas as we went along while progressively refining them.
First of all, we drew up a list of the expected public for the project itself. Major types of users were defined, with their digital usages, their contexts of use and their link with the project. The tool should be easy to share online and work on mobile.
Each stage of the design process led to a prototype, each prototype being adapted to the expressive or technical goal pursued.
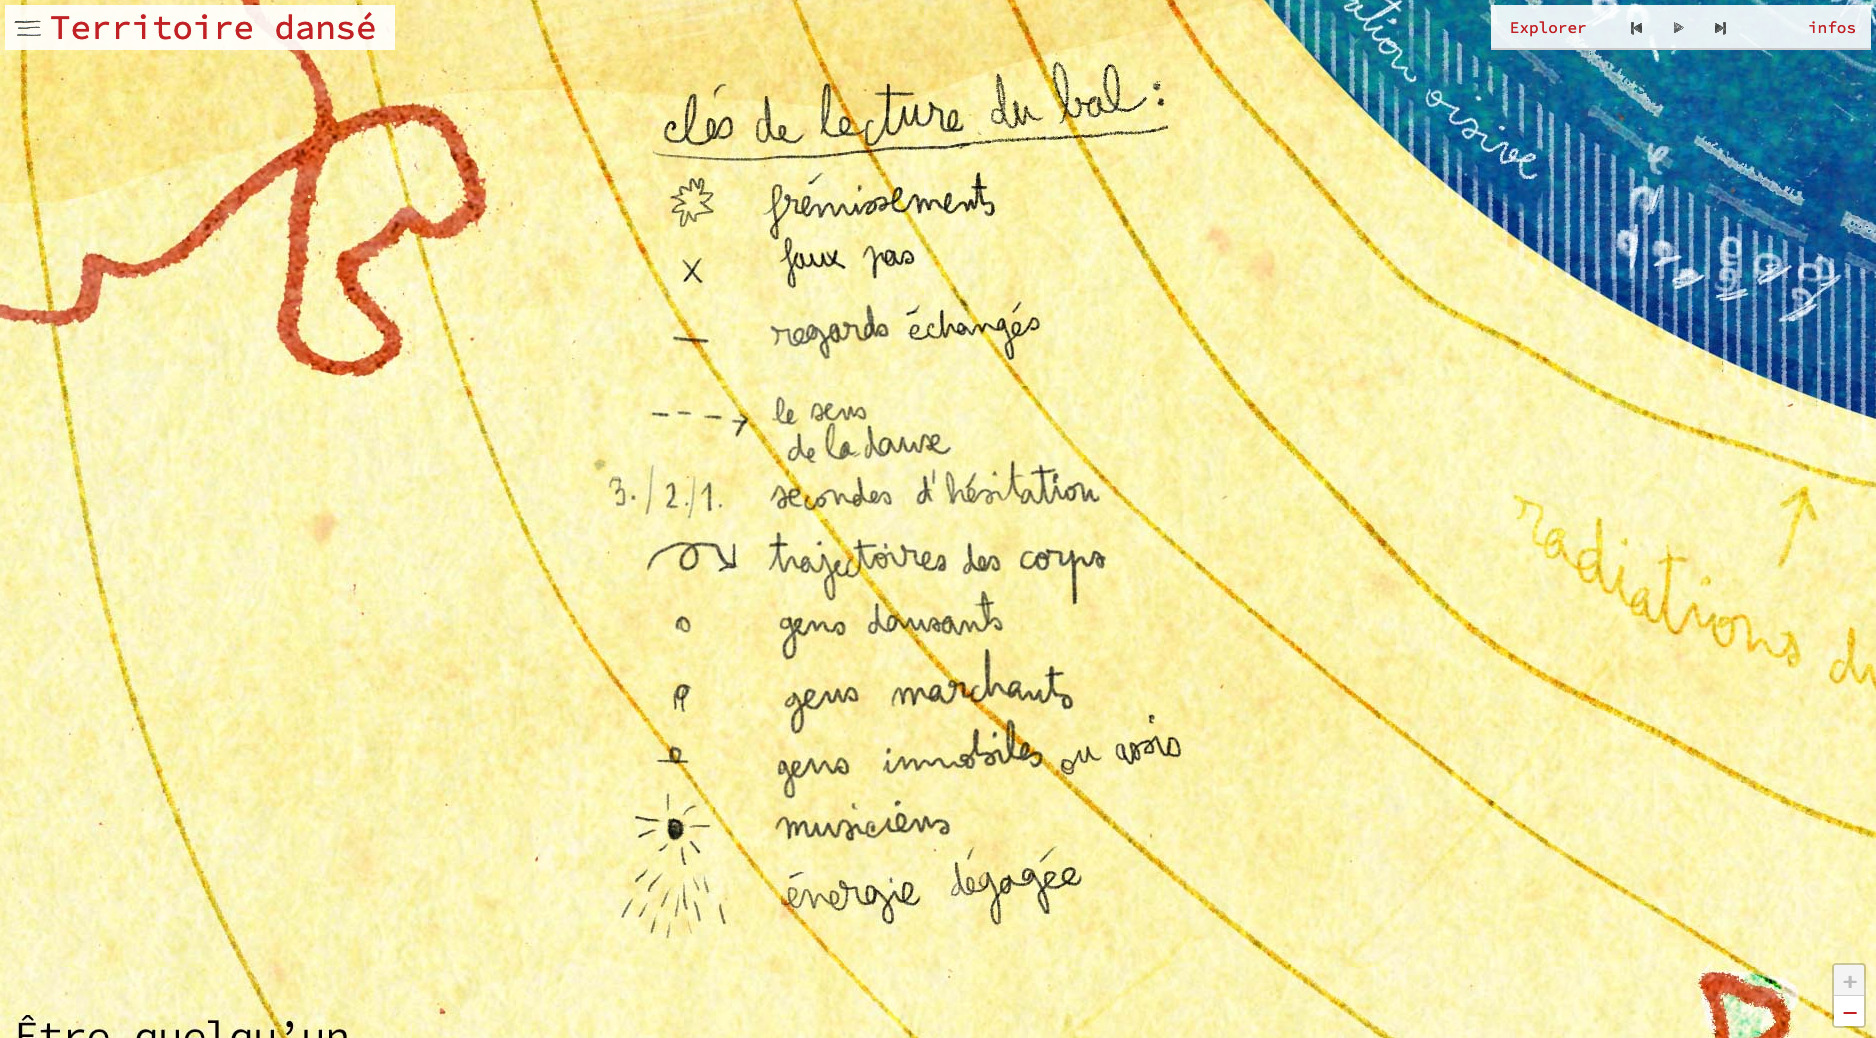
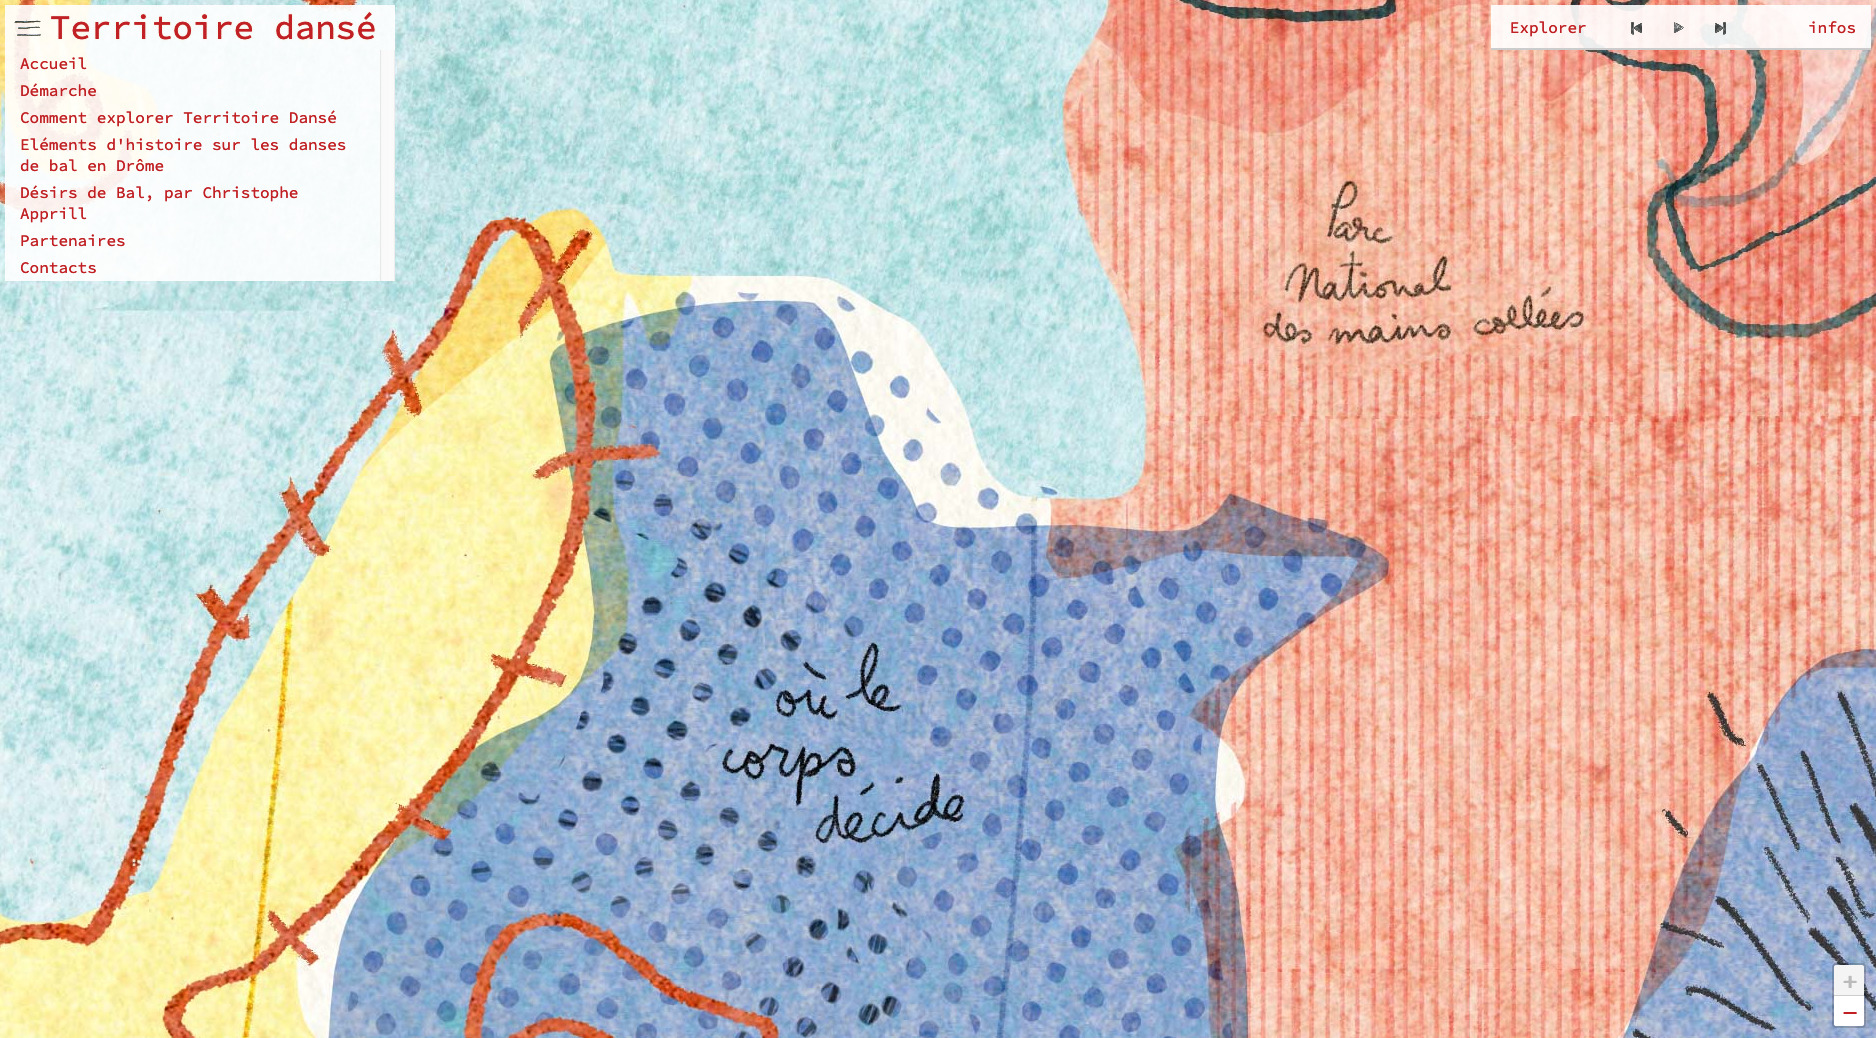
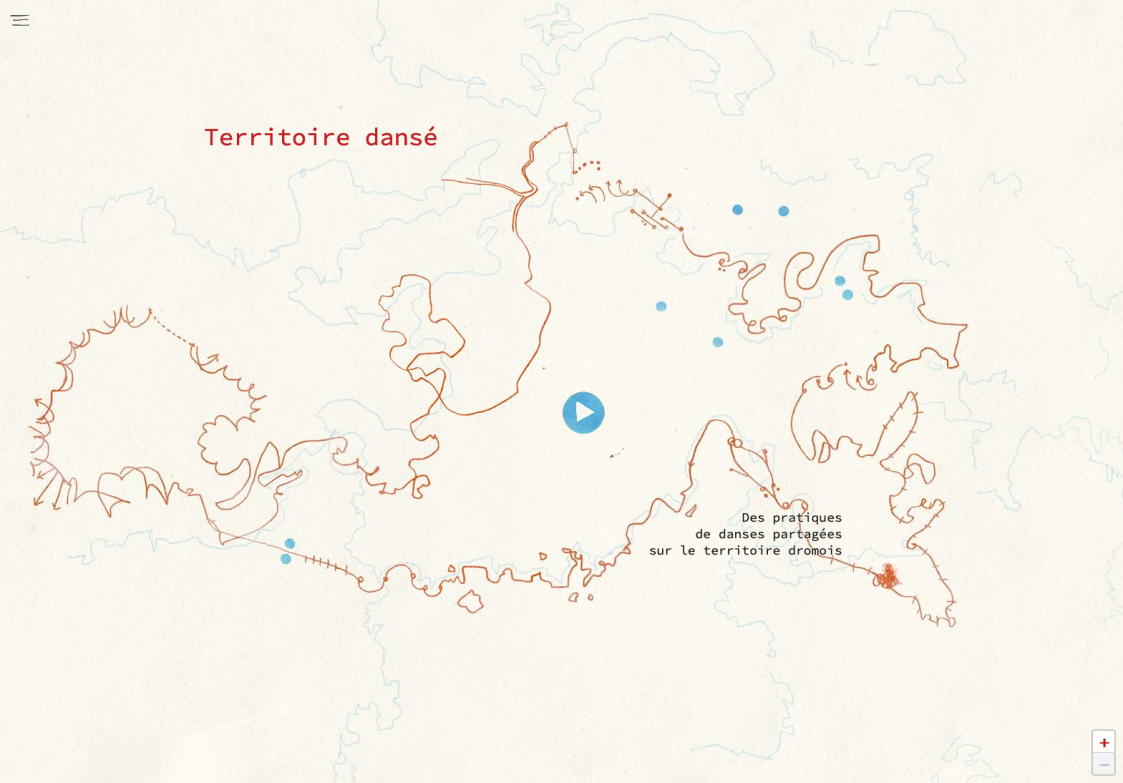
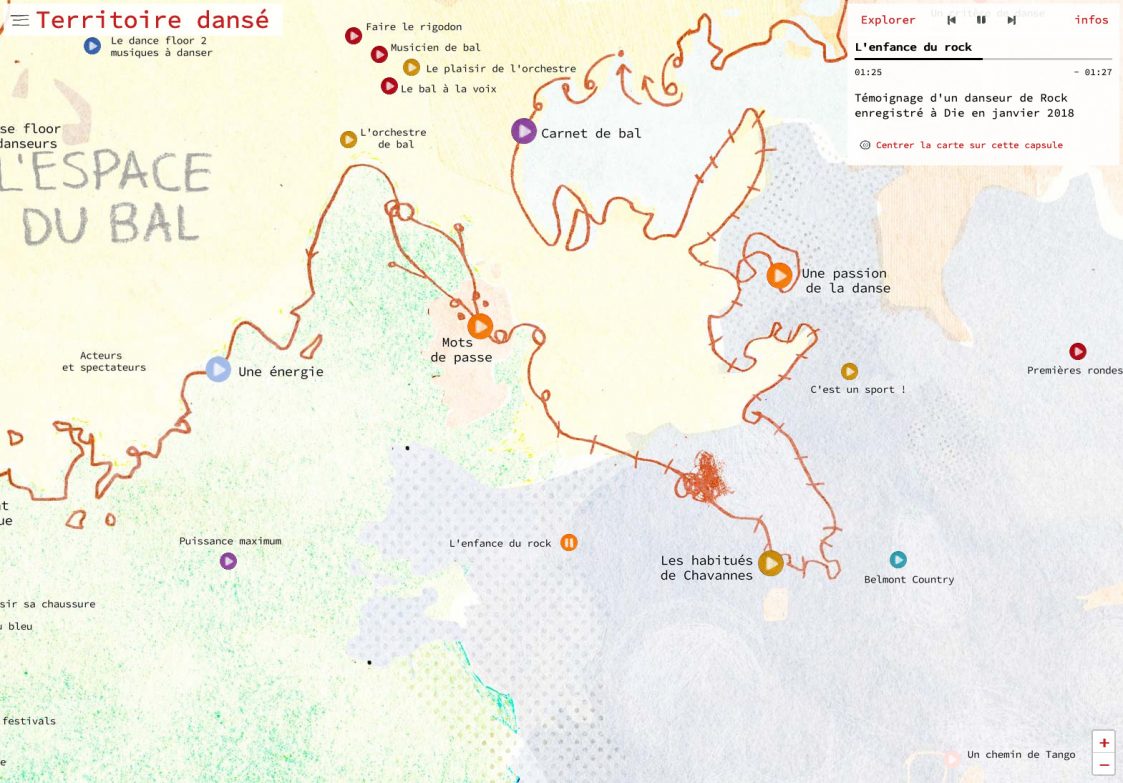
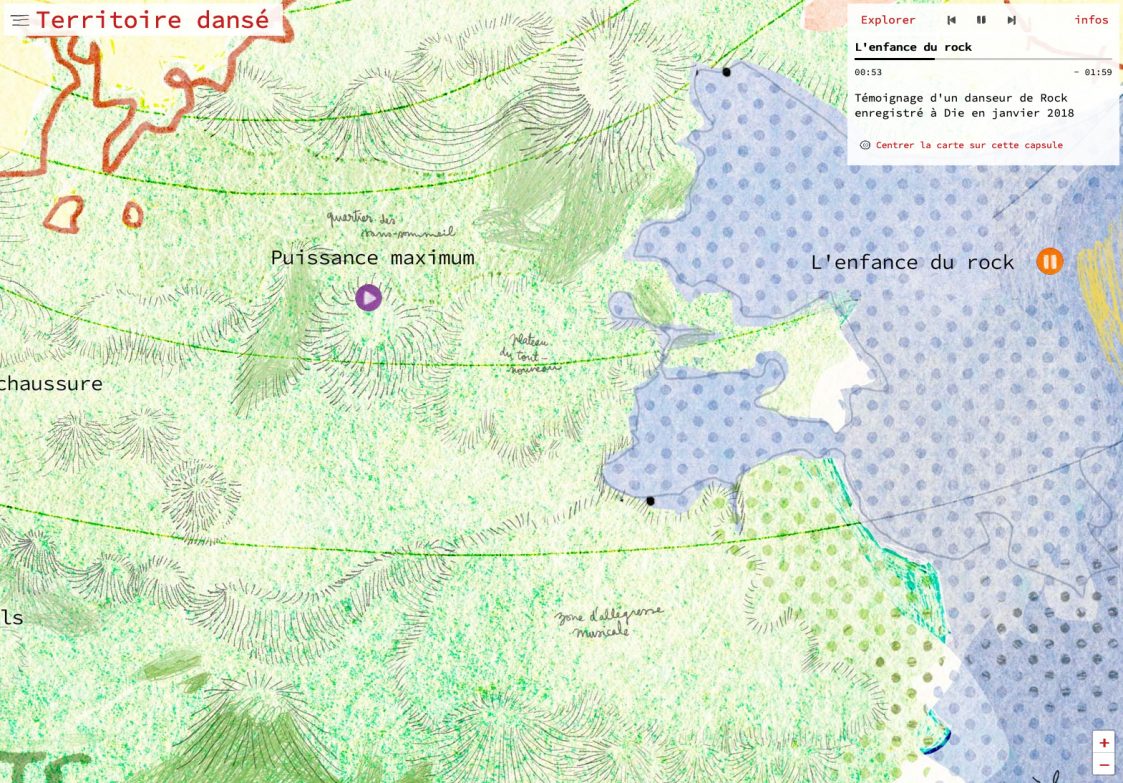
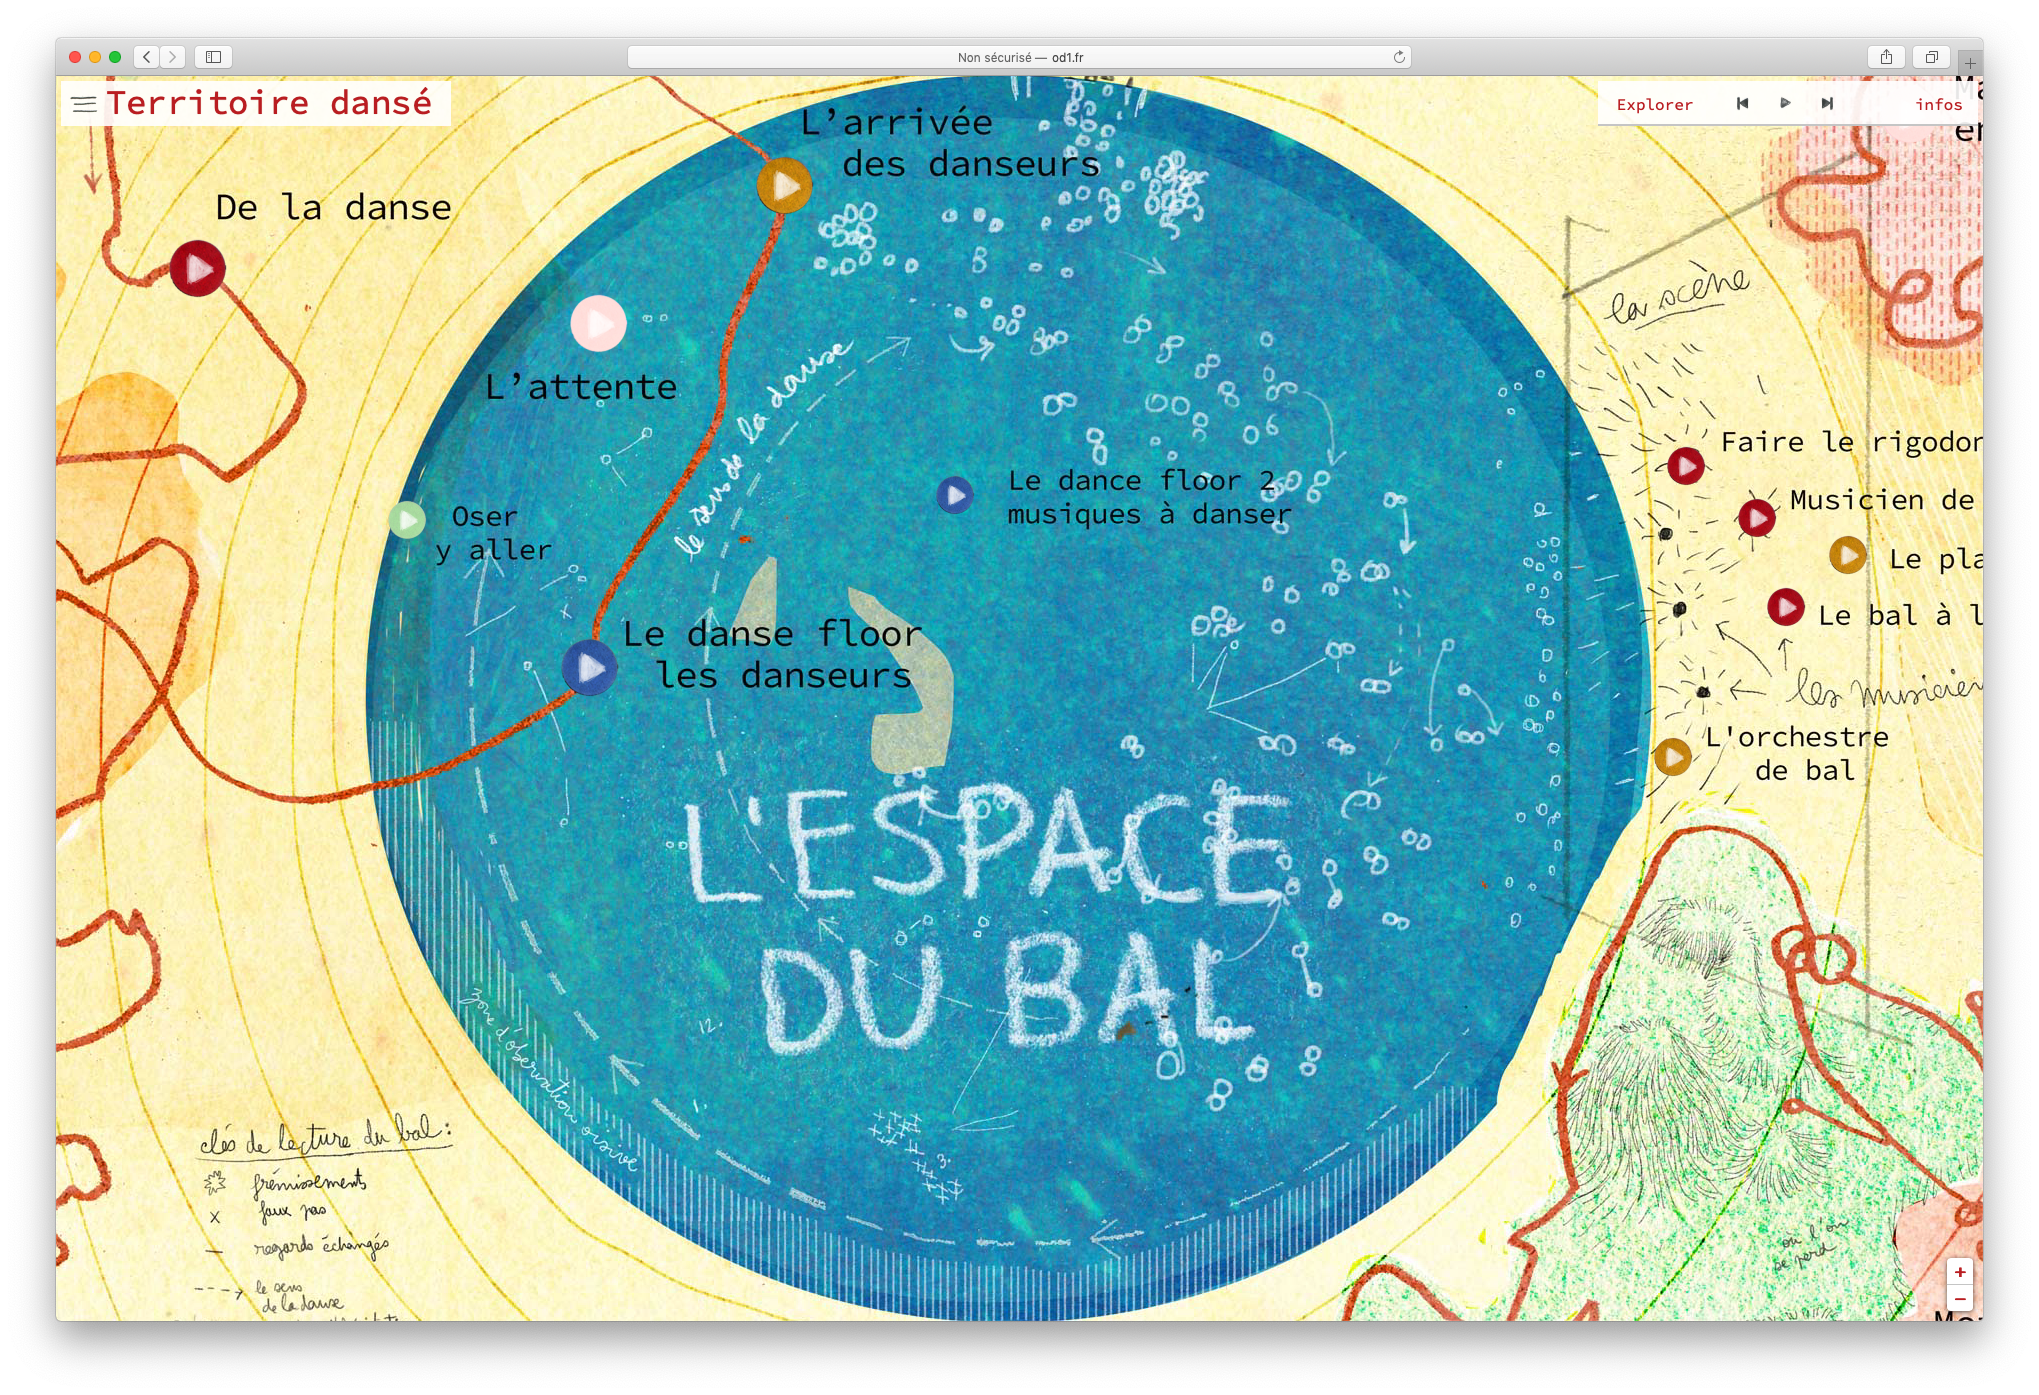
The first prototypes were sketches on paper, allowing us to quickly share our ideas. We then chose the cartographic approach, allowing a deep and intuitive exploration of a soundscape.
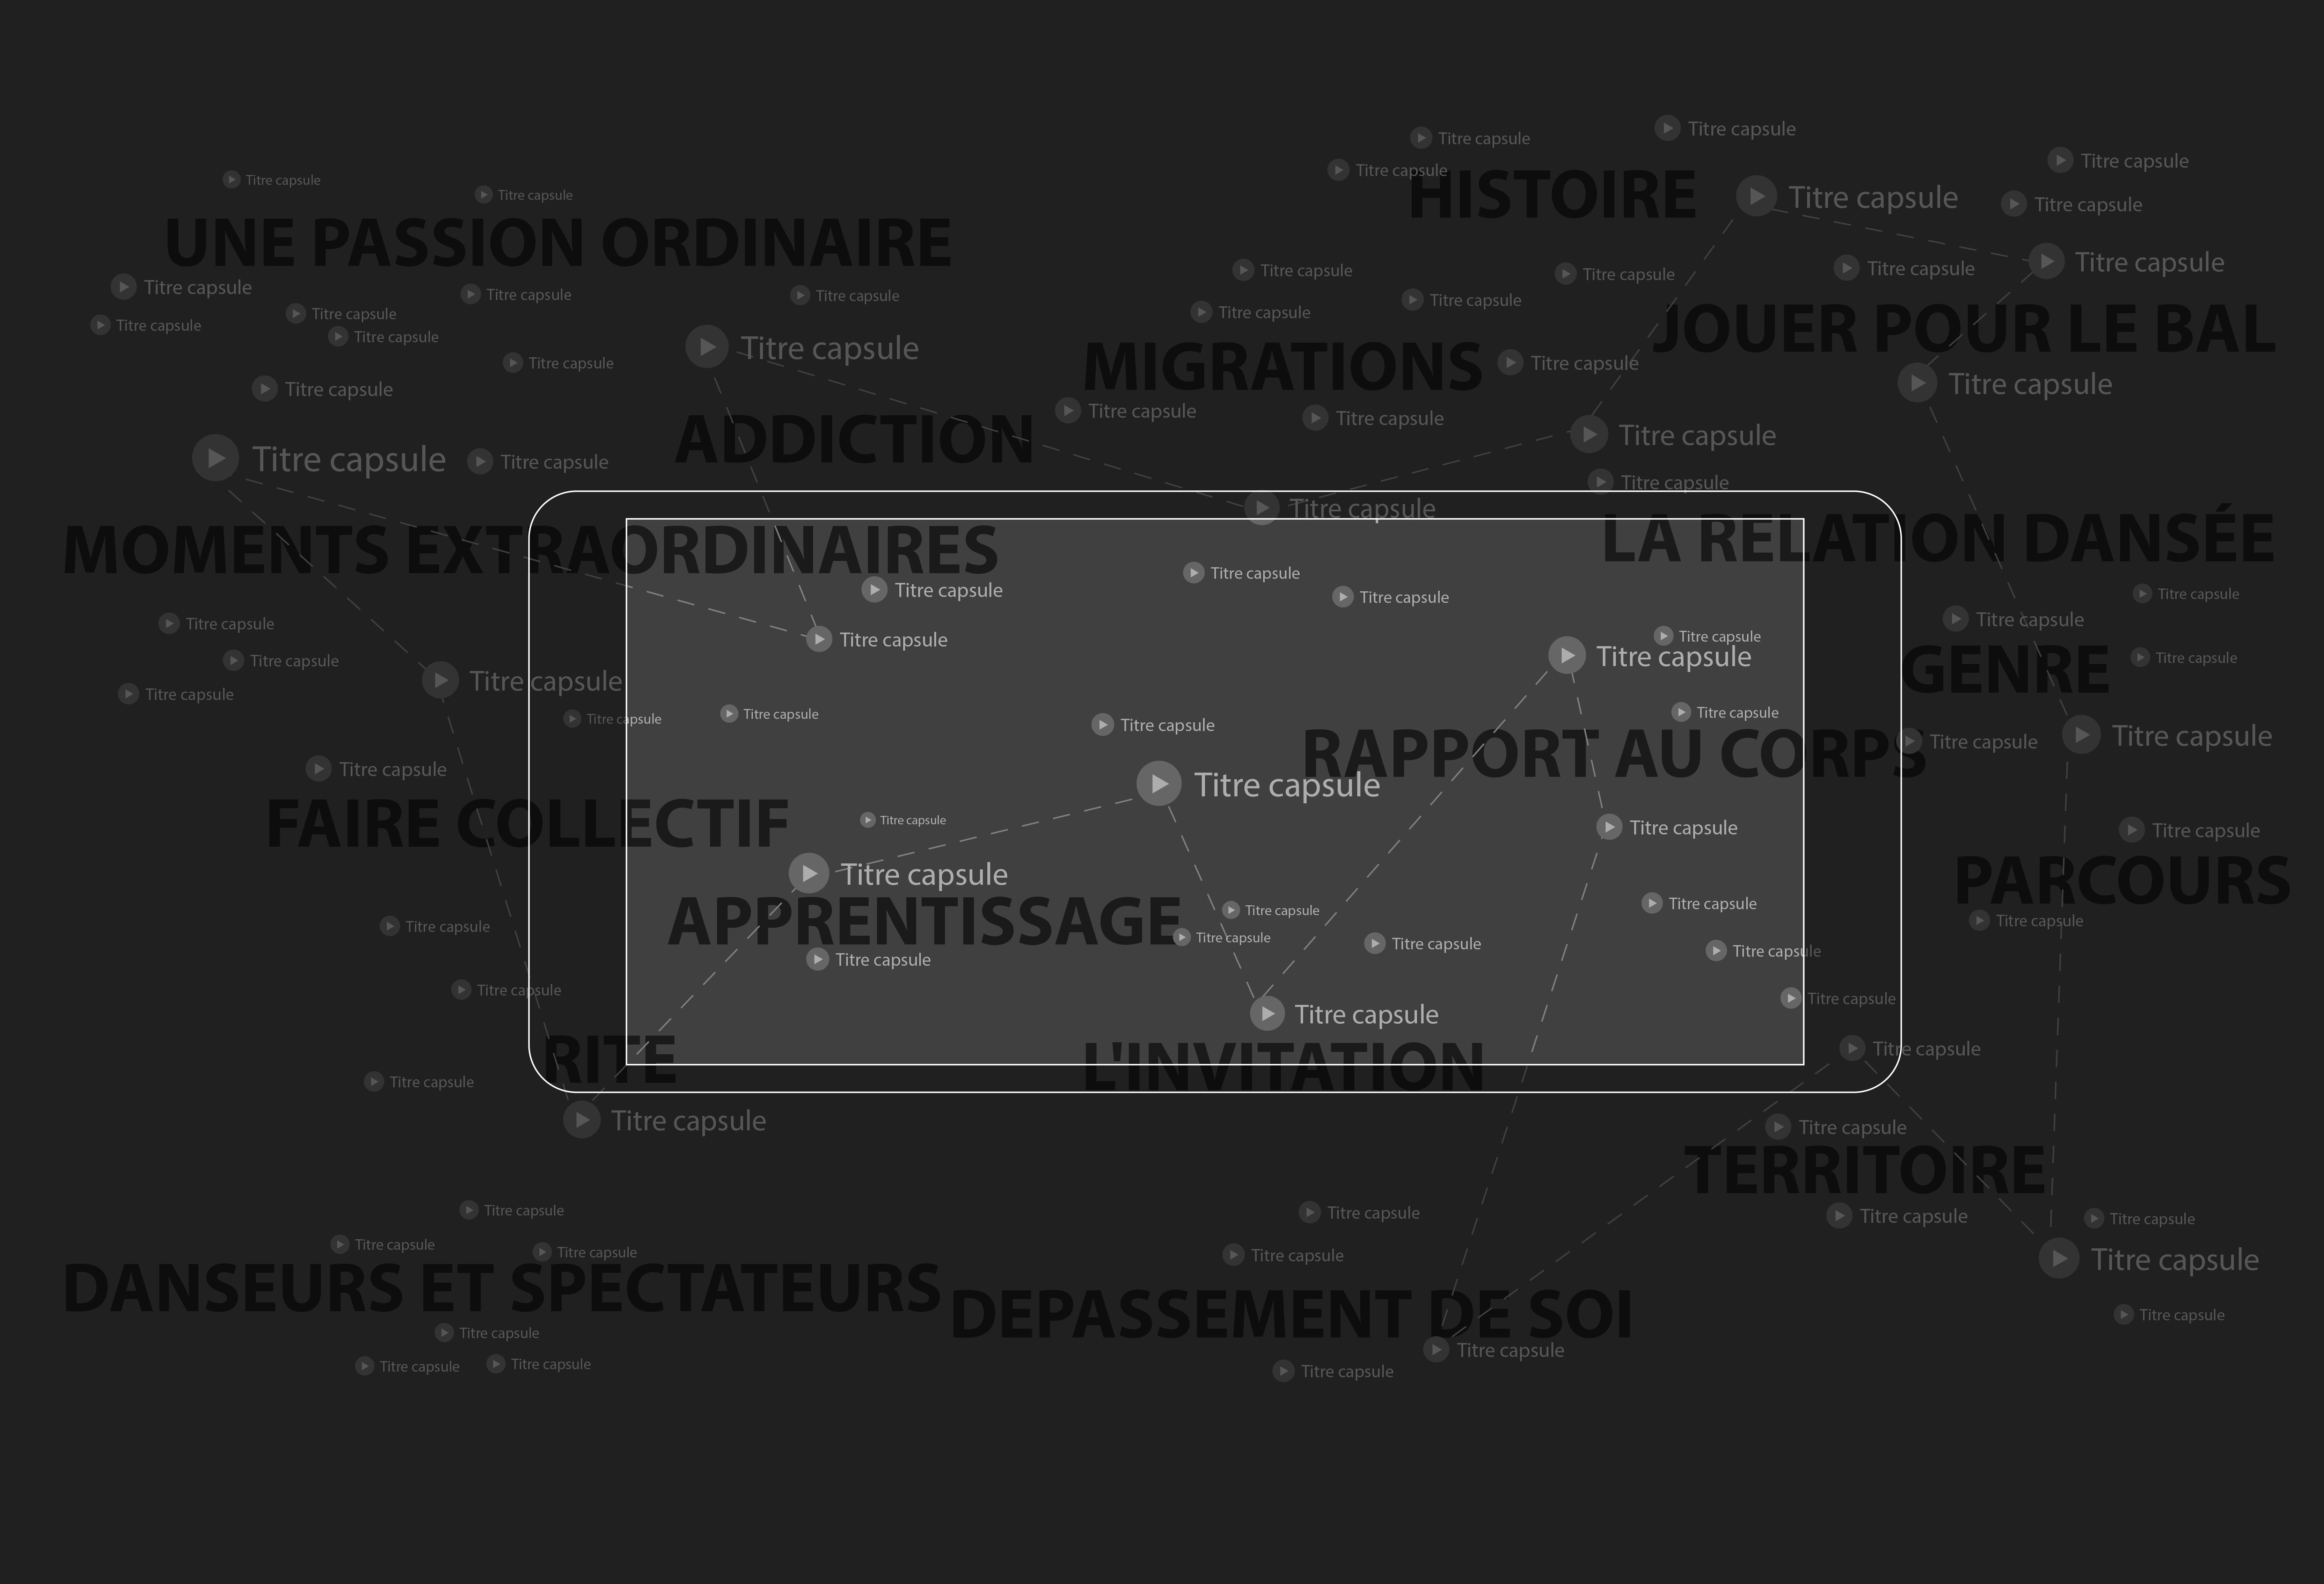
Static wireframes allowed us to visualize the information density and pointed us towards an abstract representation of the region, with no direct link to geography. We compiled the metadata of the audio recordings in an online table. This gave us simultaneously a global yet very precise overview of the contents.
Interactive and animated wireframes allowed us to understand the sequence of the different screens and to refine the navigation principle.
Finally, a functional prototype was developed in parallel with the work of the illustrator.
It is from this functional prototype that the whole team was able to really grasp the stakes of a navigation similar to that of an interactive map. I based my work on a development tool designed for online mapping (Leaflet) used with an audio player system (HolerJS) ensuring a good compatibility between the different browsing platforms. The metadata table was used as a database, allowing quick adjustments.
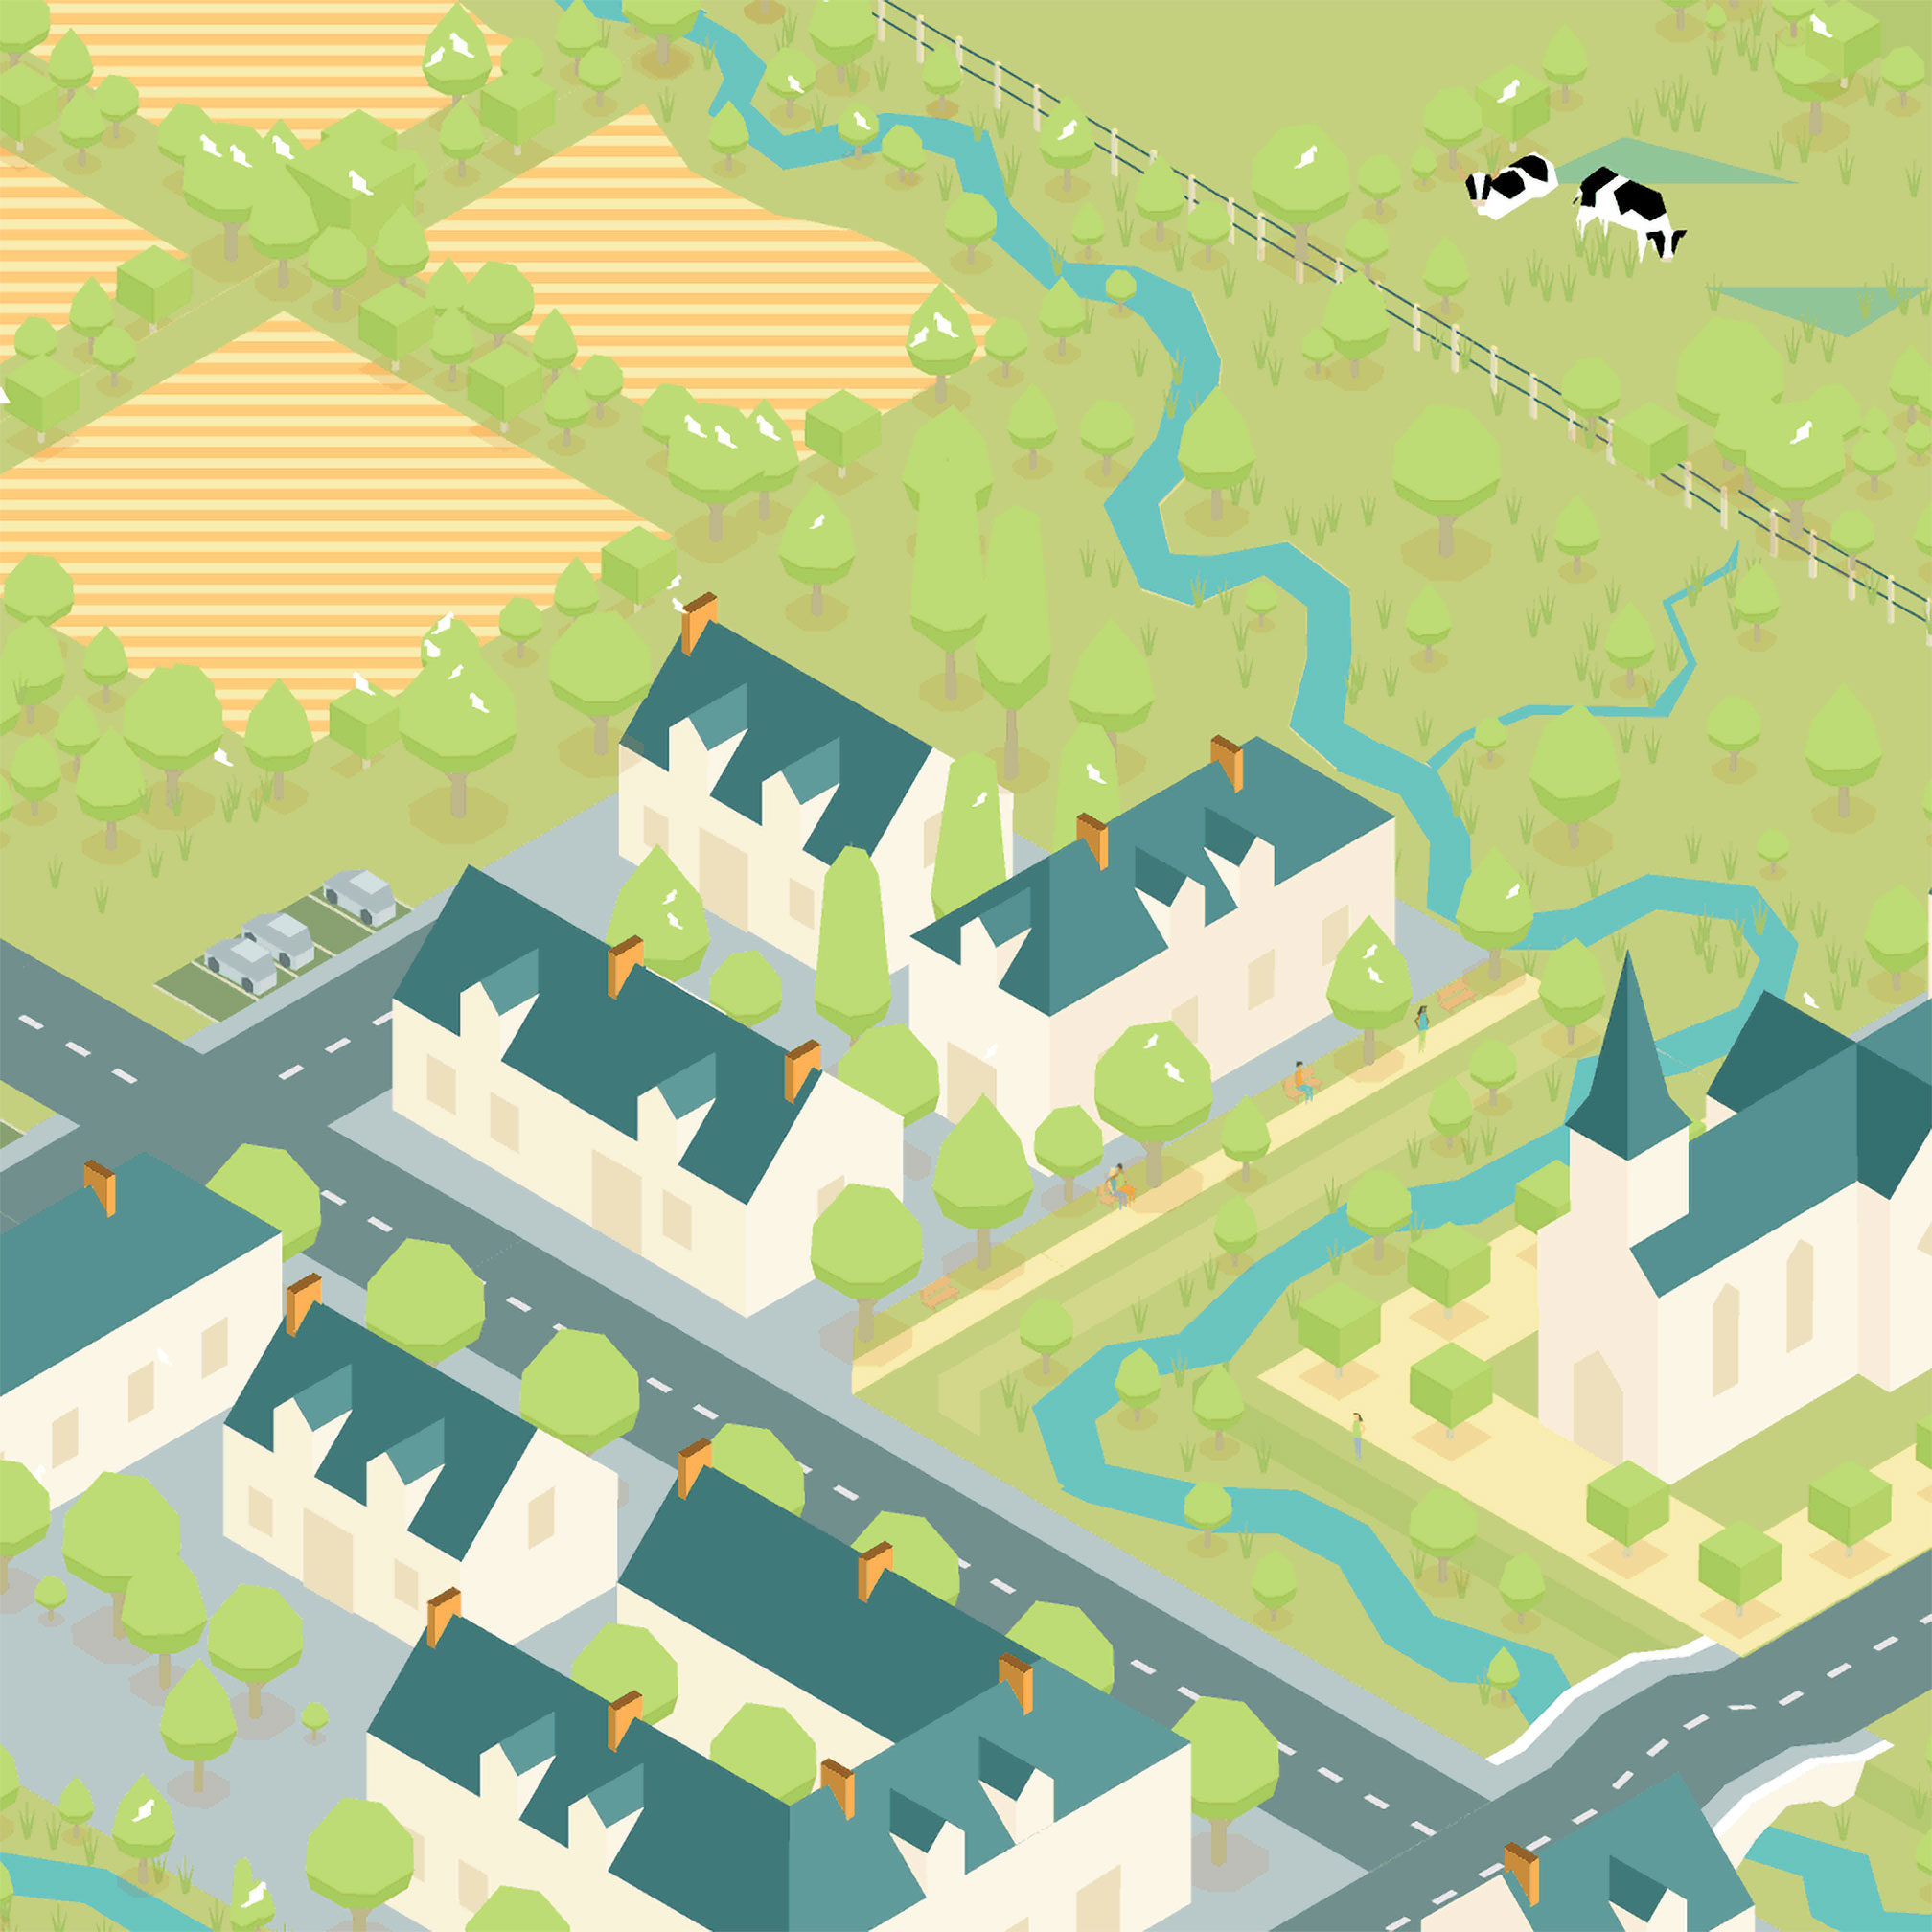
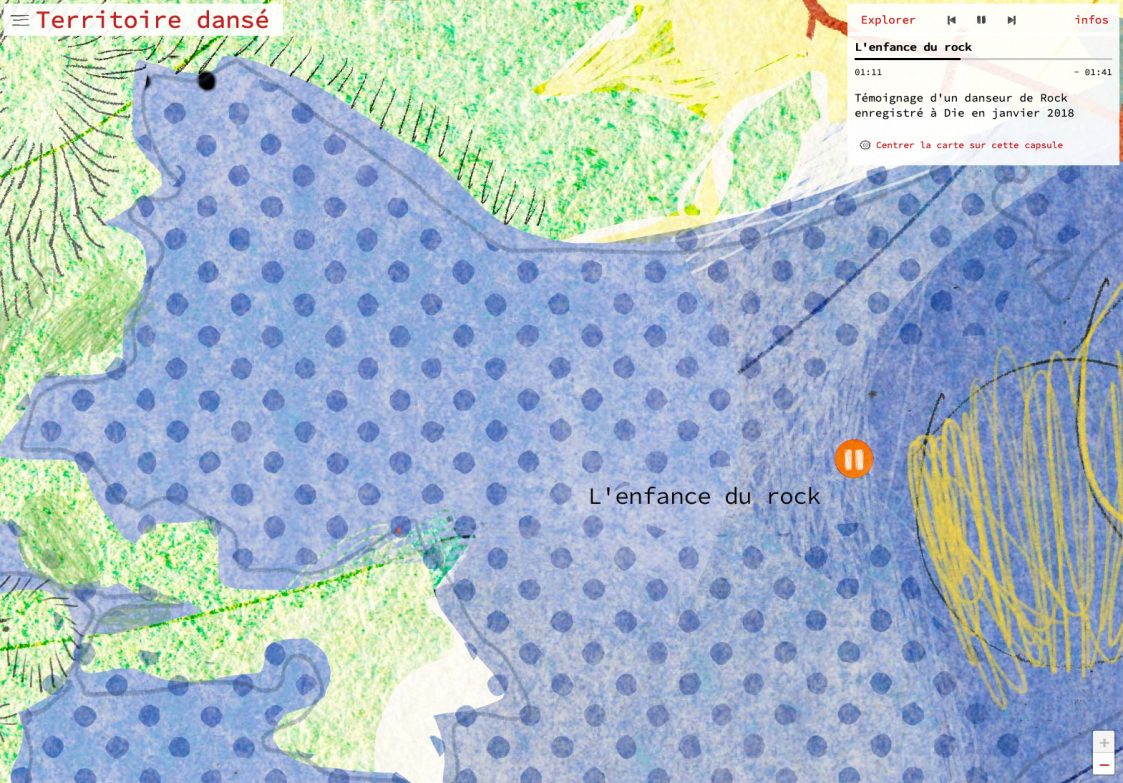
The illustration had to be drawn in several versions, one for each zoom level, allowing a progressive exploration of the contents. A visual hierarchy was set up, with some recordings appearing only at a given zoom level.
Development
All the illustrations have been sliced into 256*256 pixel squares to optimize loading times. On a retina-screen, the maximum zoom level implies an illustration of more than a billion pixels! The 98 audio recordings have been encoded in mp3, ogg vorbis and webm to ensure interoperability on all browsers. The development was based on the VueJS framework. The dynamic URL rewriting allowed direct access to the different content, text and audio, easily shareable.
Explore the map online